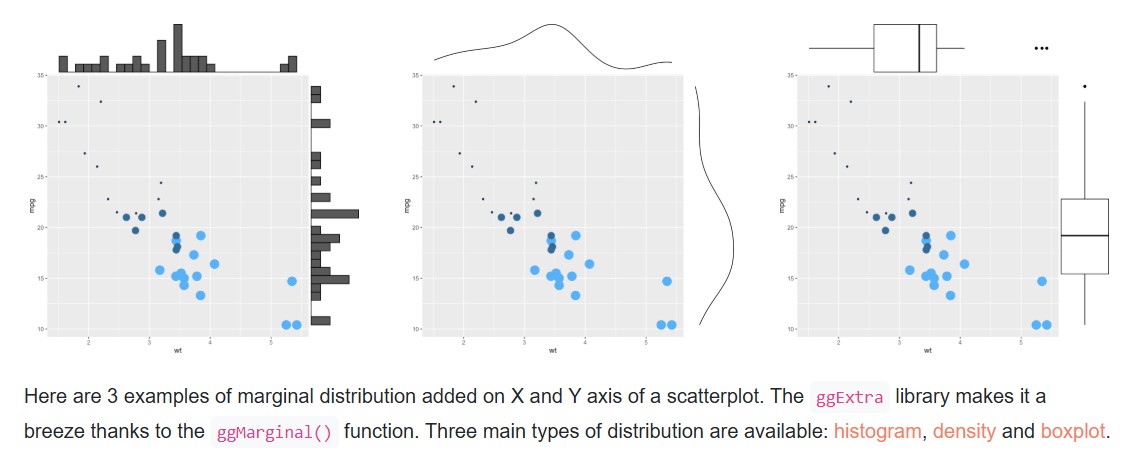
# library

library(ggplot2)
library(ggExtra)

# The mtcars dataset is proposed in R

head(mtcars)

# classic plot :

p <- ggplot(mtcars, aes(x=wt, y=mpg, color=cyl, size=cyl)) + geom_point() + theme(legend.position="none")

# with marginal histogram

p1 <- ggMarginal(p, type="histogram")

# marginal density

p2 <- ggMarginal(p, type="density")

# marginal boxplot

p3 <- ggMarginal(p, type="boxplot")AI How to Part I: Using GenAI Tools in Your Browser
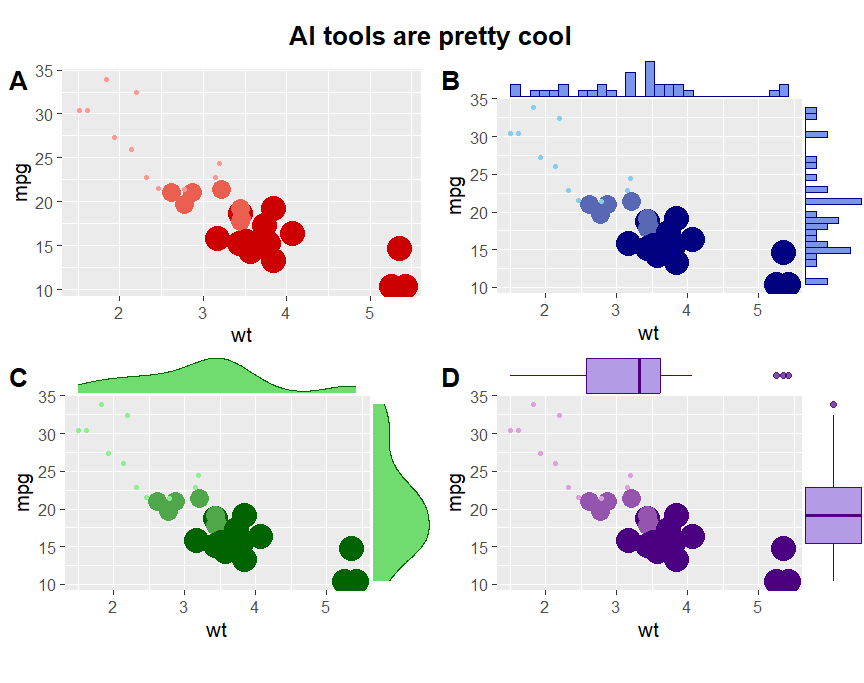
An easy, low-effort way to get a feel for GenAI tools is through browser-based interfaces. They do not require any installation or setup and do not have a steep learning curve to get started. Below is an example of using Claude to modify an R script to change figure aesthetics. Tweaking figures is one of my favorite ways to use GenAI tools. Results are easy to verify and I often find it’s much faster than looking up documentation or searching through Stack Overflow.
Browser based
Note the original code is from the R graph gallery
“You are an expert R programmer. Modify the following R code to use red colors in p, blues in p1, greens in p2 and purples in p3. Use cowplot to make a multipanel figure with the title ‘AI tools are pretty cool’”.
“You are an expert R programmer. Modify the following R code to use red colors in p, blues in p1, greens in p2 and purples in p3. Use cowplot to make a multipanel figure with the title ‘AI tools are pretty cool’”.